Read On
BY GRACE HOOD / CPR
Crippling drought this year has caused more than $1 billion in damage. As it has played out, anyone affected by the drought or trying to manage it has turned to a once obscure map that's become key to understanding what's happening: the U.S. Drought Monitor.
That includes water planners who decide resource allotments. Farmers who need water for their livelihood. Federal bureaucrats who use the map to calculate aid for the Livestock Forage Disaster Program.
And then there are citizen scientists like Dave Kitts outside of Sante Fe, N.M.
"I think it's a little obsessive, but I check it every Thursday," says Kitts, who has lived on the same 2-acre spread in New Mexico for decades. Dry years like this past one can crust the soil and kill his pinyon trees.
"It's just upsetting and depressing to me," he says. "And when it moves the other direction, it definitely lifts my spirits."
Scientist Mark Svoboda started the drought map 20 years ago, when Congress took an interest after drought struck Washington, D.C. He directs the National Drought Mitigation Center at the University of Nebraska, Lincoln.
"We're covering everything," he says, "from groundwater, stream flow, temperature."
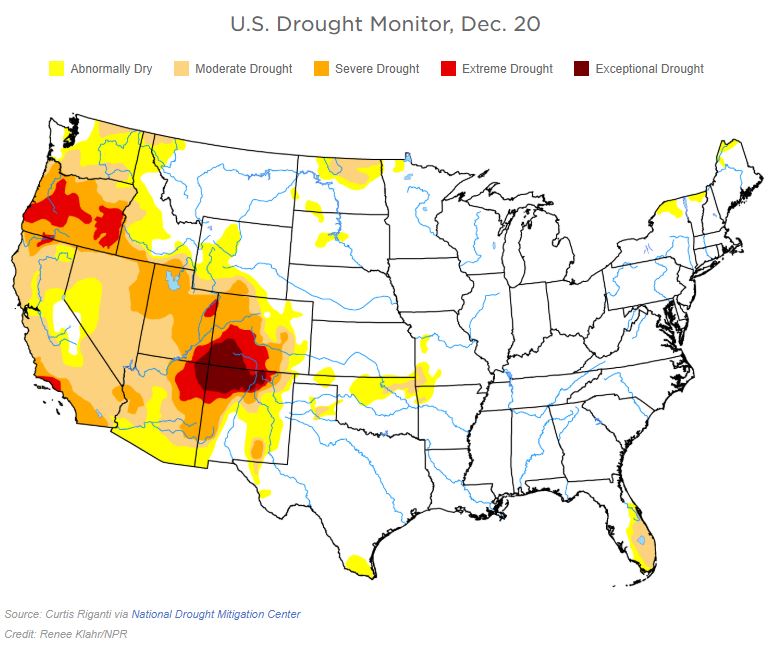
In bad drought years like this one, the map has patches of crayon yellow, orange and red that show the levels of drought. Right now there's a deep crimson bull's-eye in the hardest hit area of the southwest, where Colorado borders Utah, Arizona and New Mexico.

Sipping a diet Mountain Dew, Svoboda says the work behind the map deserves more attention as climate change makes droughts more severe.
"Droughts are like the Rodney Dangerfield of hazards," he says. "They just don't get any respect."
TV crews, for instance, rush to be on the scene for hurricanes and wildfires. But they rarely flock to desiccated farm fields, let alone focus on the federal money set aside for crop losses.
A Mix Of Art, Science And Farmer Wisdom
The Drought Monitor map is updated weekly, often taking into account input from hundreds of people, not only scientists. Ranchers and farmers from across the country also send missives to state and national offices, making the map a mix of art, science and farmer wisdom. But it starts with recommendations from state climatologists on any potential changes.
Assistant Colorado Climatologist Becky Bolinger says she has been "feeling a little bit more hopeful" about recent rain and snow, as it could mean a smaller crimson blotch in the southwest. At least that's what her data suggested.
But Bolinger wanted more context, so she asked for field reports from Colorado's farmers and ranchers.
"We've gotten some very specific examples," she says. "Like, 'Well, I went out to put in a wood post and the surface was wet, and 3 inches deep the soil was bone-dry,' " she says.
That tells her the recent rain was not enough.
She submits her recommendation along with dozens of similar reports from around the U.S. Then comes the really hard work.
Every national Drought Monitor map is authored by a single person who must coordinate all the reports and make sense of them. David Simeral, of the Nevada-based Desert Research Institute, is one of those authors.
"It's a physically and emotionally draining process," he says.
He's meticulous because each week's map has the author's name and contact information. Simeral has to justify his decisions to politicians who want more federal drought aid, and to agricultural producers who stand to receive it. Since 2011, the Drought Monitor has triggered $7 billion to ranchers through the Livestock Forage Program.
In addition to the pressure, creating the map means long hours, so the author job is rotated every two weeks.
Ultimately, it's the compilation of reports over time that help people like Colorado rancher Matt Isgar. He uses the tool to figure out where his cows should feed.
"It tells you what direction the drought is trending towards," he says. "So if you're looking for pasture or forage, you tend to go into the other direction."
This winter, Isgar will keep an eye on the colors of the Drought Monitor map, hoping the drought will leave his land as quietly as it came.
Copyright 2018 CPR News. To see more, visit CPR News.