Listen
(Runtime 1:41)
Read
An analysis of county-by-county data in Idaho showed over the course of 10 years, 39 out of 44 counties saw at least some increase in obesity.
In 2022, Nez Perce County had a 33% obesity rate among adults — a 2% increase from 10 years ago. Latah County increased from 26% to 29%, Clearwater County dropped to 31% from 32%, Lewis County increased from 30% to 34%, and Idaho County increased from 30% to 31%.
Higher levels of obesity, which is defined as a body mass index rating of 30 or higher, is strongly associated with high stress levels, said Rebekah Tague, a registered dietitian based in Coeur d' Alene. That was especially the case during the pandemic, she said, where many states, including Idaho, saw more obesity along stressors like increased housing and financial insecurity.
Data from local counties seems to reflect that. Nez Perce County saw a 1% increase in obesity from 2019 to 2022; Latah County was at 7%; Lewis County at 6%; and Idaho County at 5%. Clearwater County saw no changes.
There are three main reasons stress increases obesity rates, Tague said. One is that cortisol, the hormone released in times of stress, slows the metabolism and increases sugar cravings. Another is that people who are stressed and overworked often struggle to prepare foods themselves, and rely more on prepackaged items that are less nutritious.
“Think of a parent being busy working two jobs, dealing with different schedules, trying to juggle the meals and times of their family,” Tague said. “It's hard to meal prep and hard to incorporate healthy lifestyle things into their day, and for their kids.”
Lastly, high stress levels, along with loneliness, isolation and depression that increased during the pandemic, can trigger emotional eating as a coping mechanism, she said.
“Food really could provide a dopamine high,” Tague said. “And then people feel guilty for that. And then that causes them more stress … and you've just got a crazy cycle going on.”
hough obesity rates can provide some indication of a community’s overall health, Tague also warns that it isn’t always the best indicator of an individual’s health. Though it can be helpful as a general guideline, it can’t account for person-by-person differences in body composition, bone density and other factors.
“I've had high school athletes with high muscle mass come into my office concerned because they're overweight. And then (they realize) that no, they're not overweight,” she said. “I've had people who have had lots of compliments on their body weight, but really, they need to be admitted to the hospital because of their eating behaviors.”
Genetic differences can also mean some people have features that result in a higher BMI score while still being healthy for them, Tague said.
“Some people could have bigger bone structures and fitting into a ‘healthy’ BMI range would actually be really unhealthy for them,” she said. “So they might be considered overweight or obese, but actually, they're fine. They're in good health.”
Measures including blood pressure, triglycerides, cholesterol and hormone levels are all important factors in determining a person’s health, and paint a better picture than BMI alone. Tague said it’s also important to look at lifestyle choices like exercise, smoking and eating habits.
“Nobody's a cookie-cutter mold,” she said. “So I think it's so much more important to take a step back and look at the overall picture of a person's health, their habits and their wellness.”
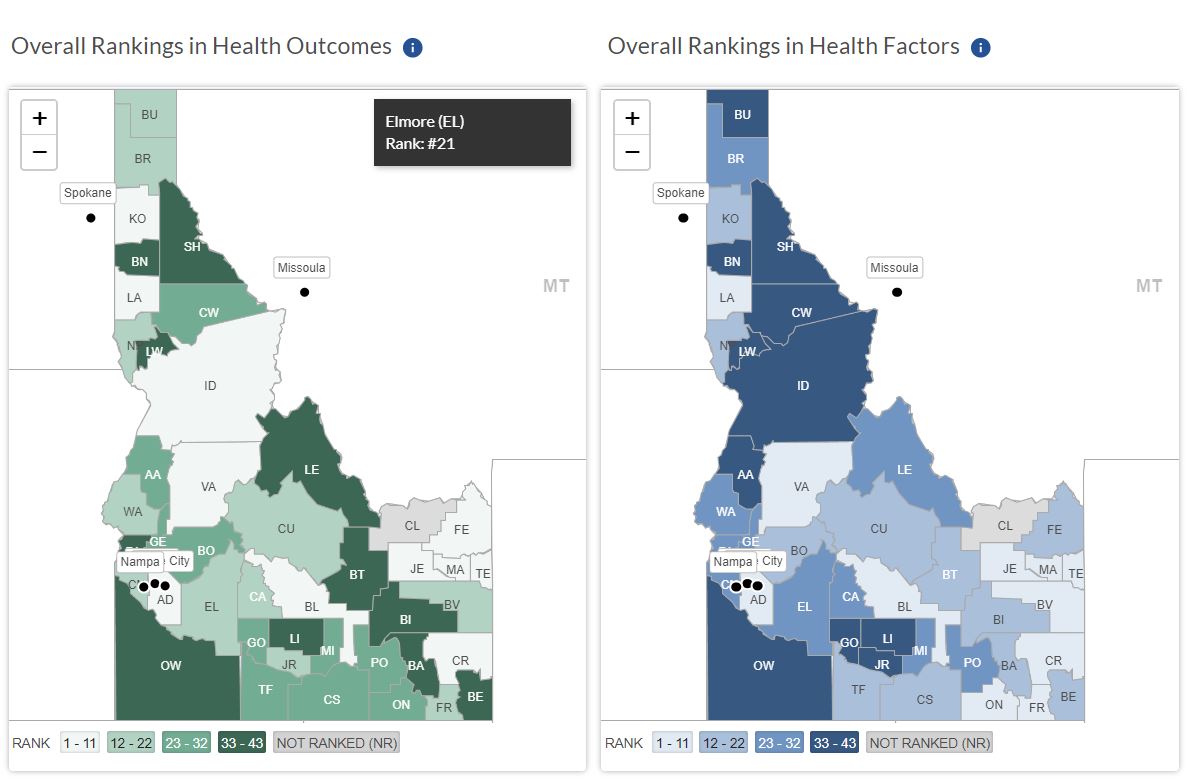
County Health Rankings and Roadmaps, the website which published the data, also publishes annual rankings of overall health outcomes and “health factors” by county, with data including tobacco use, access to clinical care, employment and education, housing and air and water quality.
Counties with a score between 1-11 were considered top-ranked, while those with scores of 33-43 were bottom-ranked.
In the Idaho North Central Health District, Lewis County ranked the lowest with a score of 36 in health outcomes and 38 in health factors. Clearwater County followed at 24 and 39, Nez Perce at 17 and 12 and Idaho County at 10 and 36. Latah County had the best scores in the region, with a 4 in health outcomes and 2 in health factors.
This report is made possible by the Lewis-Clark Valley Healthcare Foundation in partnership with Northwest Public Broadcasting, the Lewiston Tribune and the Moscow-Pullman Daily News.