EDITOR’S NOTE & UPDATE, Nov. 30, 2018: This article was first published Nov. 15 with information and voter turnout numbers from Washington’s Secretary of State that was subsequently updated. The article has been updated to reflect final turnout numbers from the 2018 election, and to explain the difference between how voter turnout is measured as a percentage of registered vs. eligible voters.
The numbers are officially in on the 2018 election.
According to the Washington Secretary of State, 2018 voter turnout of nearly 72 percent was higher than past elections, especially compared to the 2014 midterm at 54 percent.
But there’s an important note on numbers: Washington’s Secretary of State measures voter turnout as a percentage of registered voters who returned a ballot. But political scientists generally refer to turnout as a percentage of eligible citizens who voted. Think of it not like comparing apples and oranges, but more like apples and pears: similar, but some key differences.
If that doesn’t sound all too different, think about this: In the 2014 general election, the last comparable midterm, the Washington Secretary of State estimates 5.3 million people were eligible to vote. From that possible number, 3.9 million people were actually registered to vote. And only 2.1 million from that group – less than half the eligible population – actually returned a ballot.
In other words, in Washington, depending on how turnout is measured, it’d look like this for the 2014 midterm:
-Percent of registered population who voted: 54.16
-Percent of eligible population who voted: 39.51
Washington Counties: High And Low
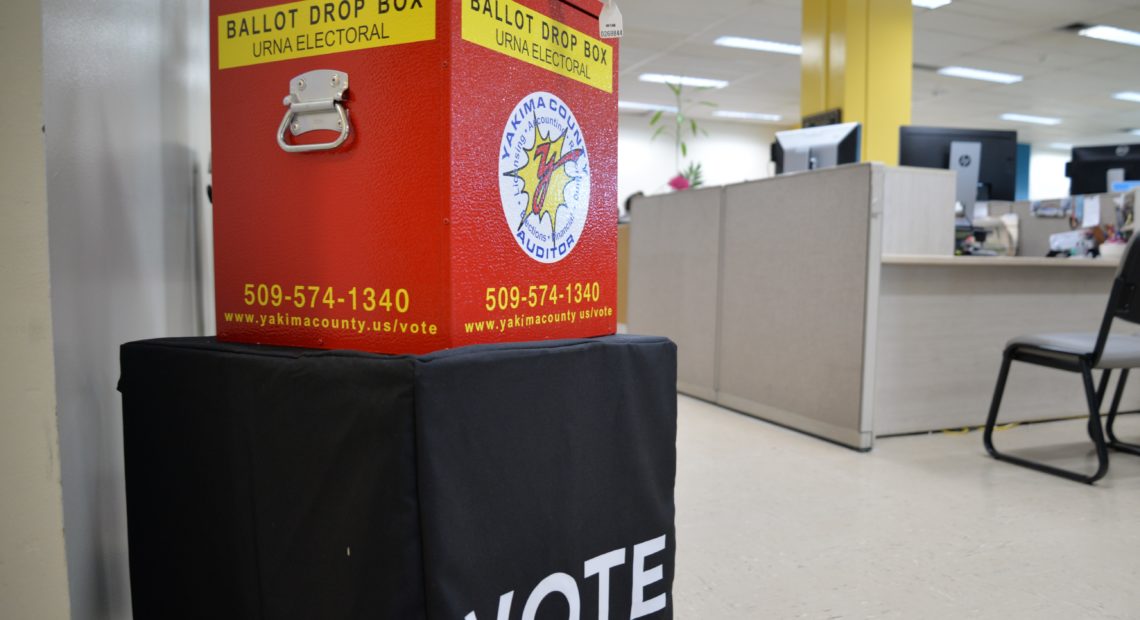
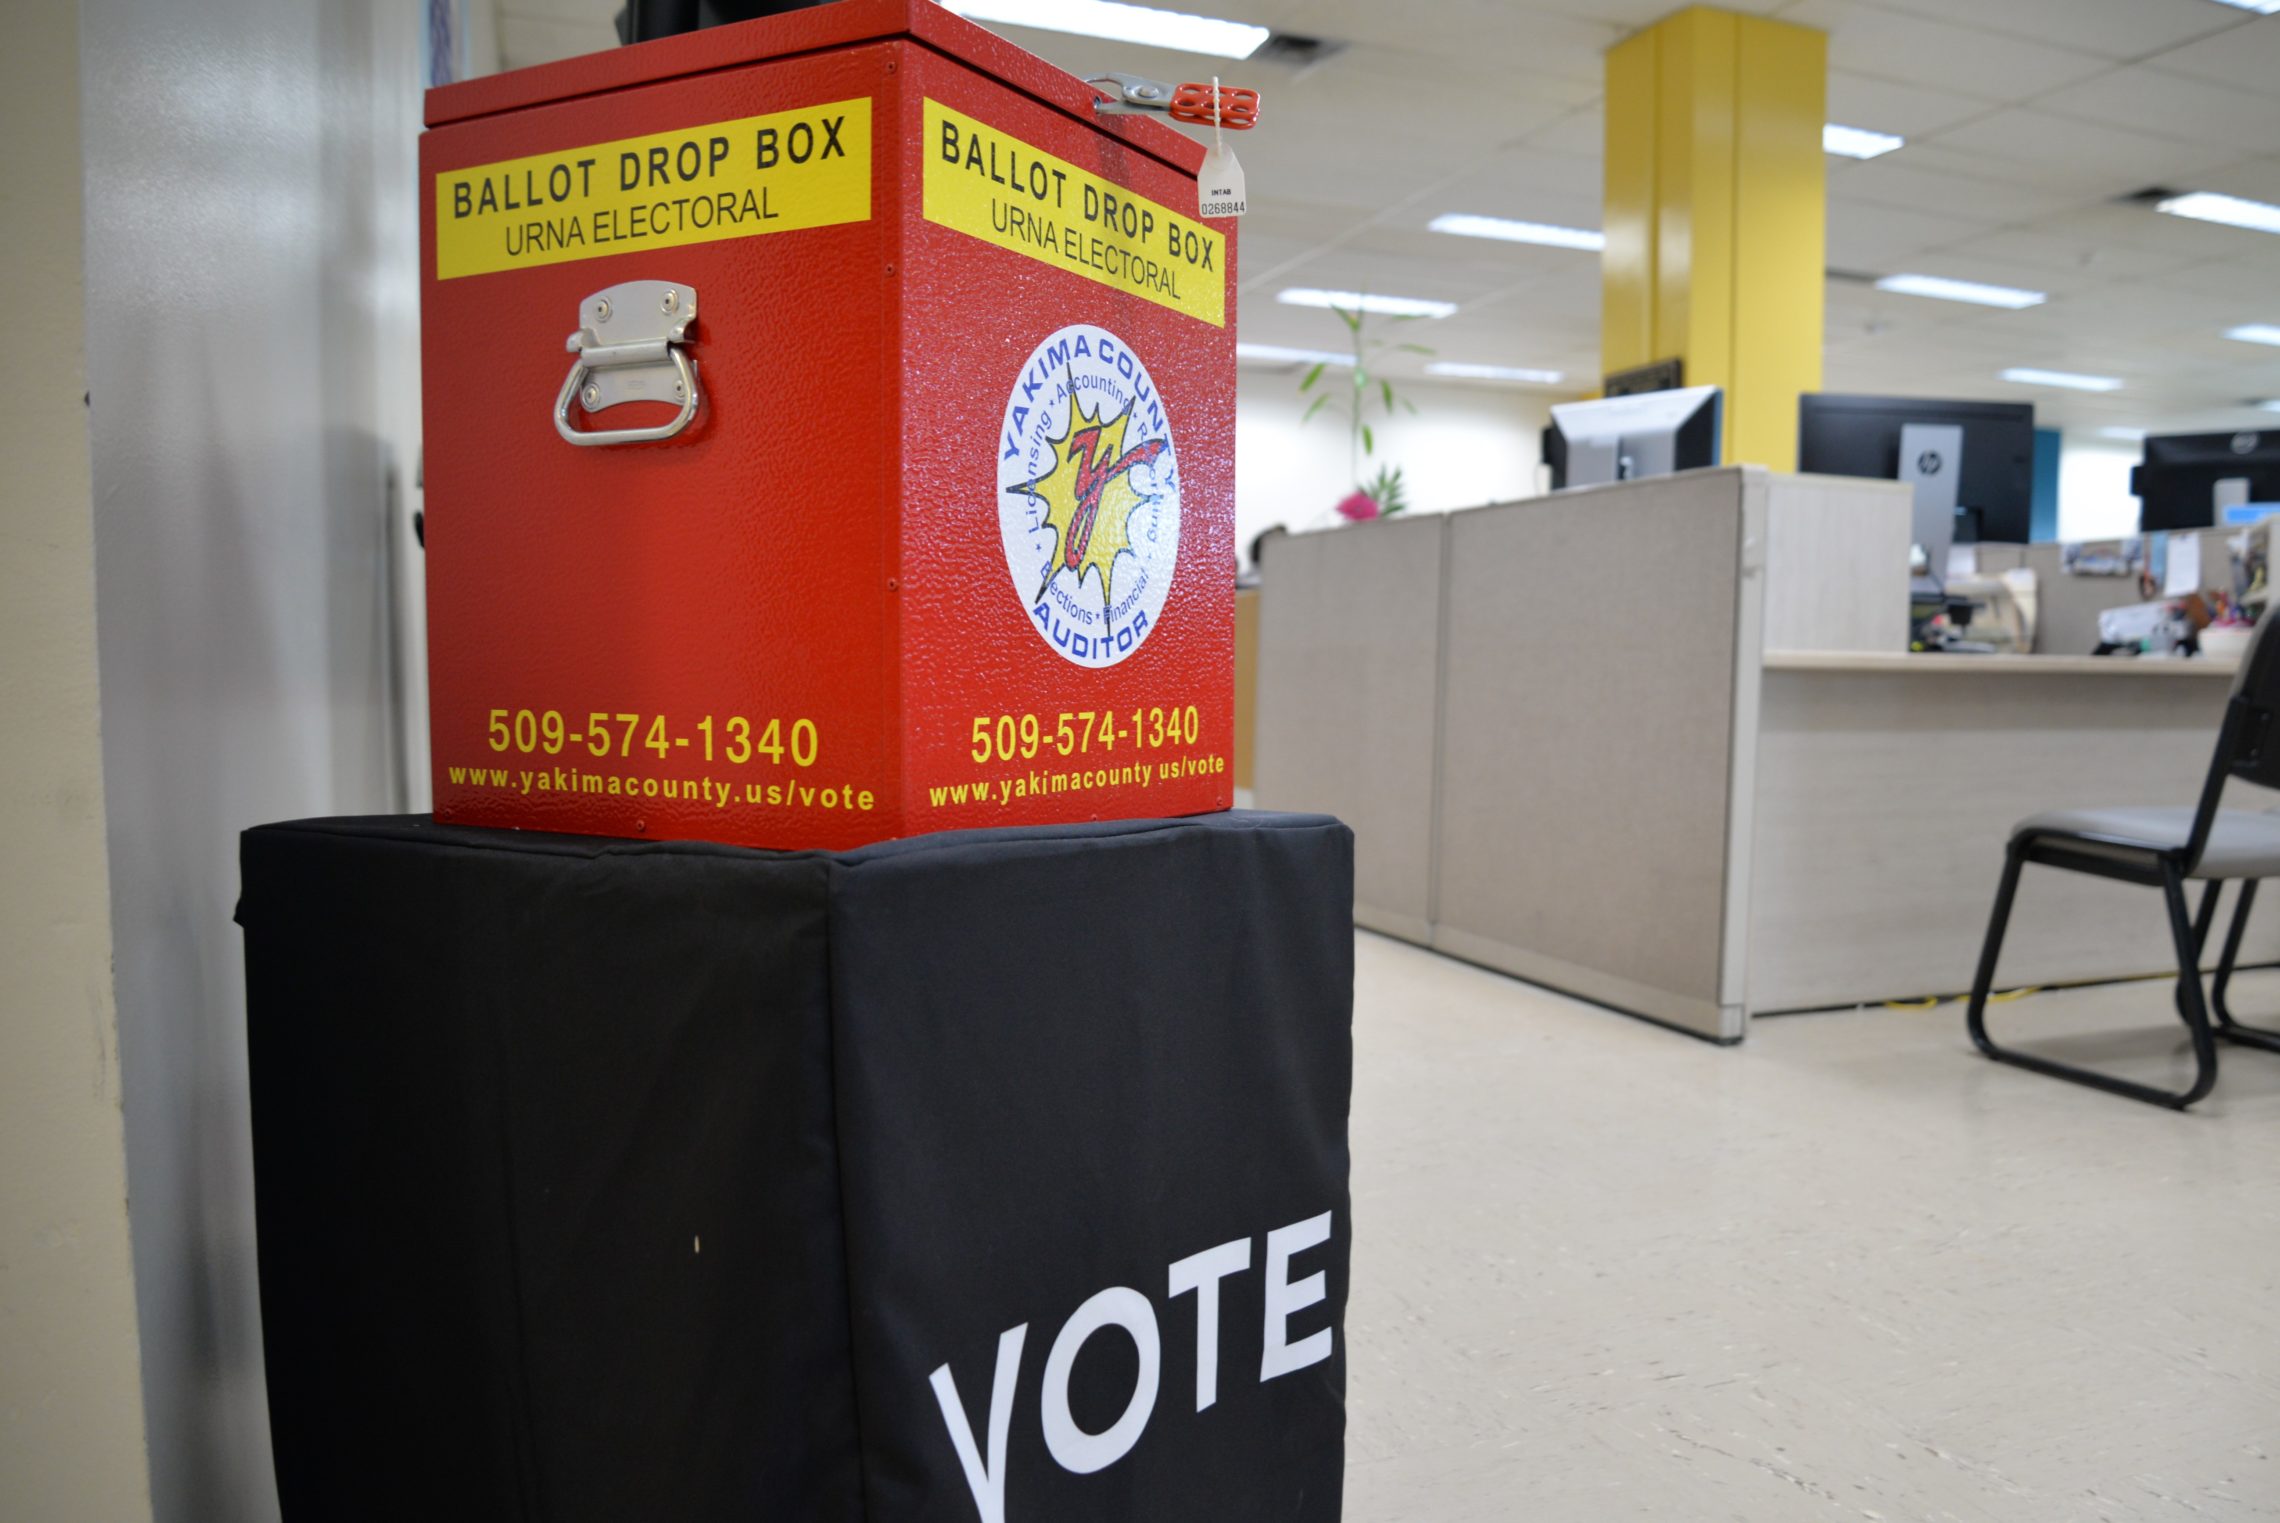
In 2018, San Juan County had the highest voter turnout at nearly 84 percent, while Yakima County had the lowest at 61 percent. (Again, that’s measured as a percentage of registered people who voted.)
One major reason for that gap: demographics.
Yolanda Arellano is with the Yakima County Elections department. She works to make sure Spanish-speaking residents get the same information as English speakers. While Latino voters don’t generally turn out as much, this year the number was higher than expected, but still lower than the general population.
“With regards to voters with a Spanish surname, we actually saw a really good turnout this time around,” Arellano said.
In Yakima County, where Latinos are about a third of registered voters, nearly 41 percent with Spanish surnames voted. That’s lower turnout compared to those with non-Spanish surnames, at 70 percent, but Arellano counts it as a win for voter engagement.